AMSUITE (Parametric Modelling Suite for EMTP) is a module for EMTP® for parametric studies. By importing the base-case EMTP® file into PAMSUITE, the user can perform the following kinds of studies:
- Simulation with parameter uncertainties (Monte Carlo)
- Sensitivity Analysis
- Contingency scenarios exploration
- Optimization
- Data Assimilation (data matching)
Simulations run in parallel using as many cores as possible. Simulation results are shown on-line, while the simulation process is on-going.
PAMSUITE includes a powerful environment based on Matlab® for the exploration and analysis of the results and the identification of the critical parameter values. All the EMTP® simulation types are handled: steady-state, load-flow, transient and frequency scan.
Generic formulation of Parametric and Optimization problems in PAMSUITE. Pj and Sj represents respectively the model parameters and the output signals.
PAMSUITE is not problem specific, as user-defined pre- and post-processing can be defined. PAMSUITE can be used for a large variety of studies including:
- Determination of model parameters (data matching with measurements),
- Lightning and switching transients,
- Transformer energization studies,
- Passive filter designs,
- Control system parameters optimization,
- Determination of equivalent impedance locus,
- …
PAMSUITE is developed and intensively used by EDF® (the national French utility) for a large scope of parametric studies.
Simulation with parameter uncertainties (Monte Carlo)
In practical EMT studies, data uncertainty is frequent. Uncertainty can be due to the randomness of the physical phenomenon (lightning strike current amplitude, transformer residual flux, circuit-breaker pole closing span, fault location….) or due to the limited knowledge or the lack of data (transformer air-core reactance, generator reactances…).
Options are available in PAMSUITE to define parameters of different natures and link them to EMTP® models. Types of parameter include, among others:
- Random Gaussian (Ex: circuit-breaker pole closing span)
- Random Uniform (Ex: fault instant over the power-frequency period)
- Random Log-Normal (for lightning studies)
- Discrete Uniform (Ex: fault location)
- Algebric function
Dedicated post-processing tools are available to process a large amount of data. It is also possible to export results to Matlab® and Excel®.
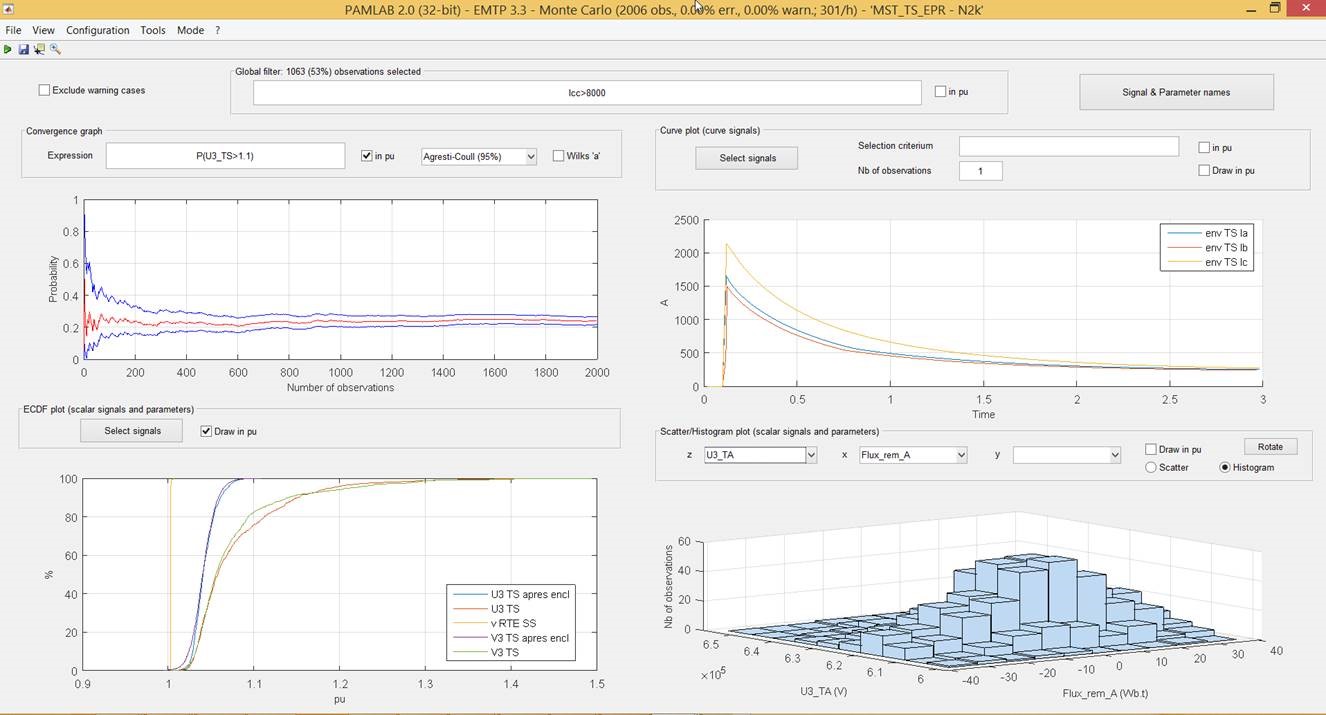
Example of Monte-Carlo analysis results (transformer energization study).
The interval of confidence of a given output is calculated and displayed while the calculation is on-going.
Sensitivity Analysis
Sensitivity analysis is defined as the study of how uncertainty in the output of a model can be attributed to different sources of uncertainty in the model input. In the context of EMTP® and PAMSUITE, sensitivity analysis refers to understanding how the parameters of an EMTP® model influence the simulation results.
The so-called Morris and Sobol methods are implemented in PAMSUITE to determine, with a limited number of runs, what are the most influential parameters of a given model.
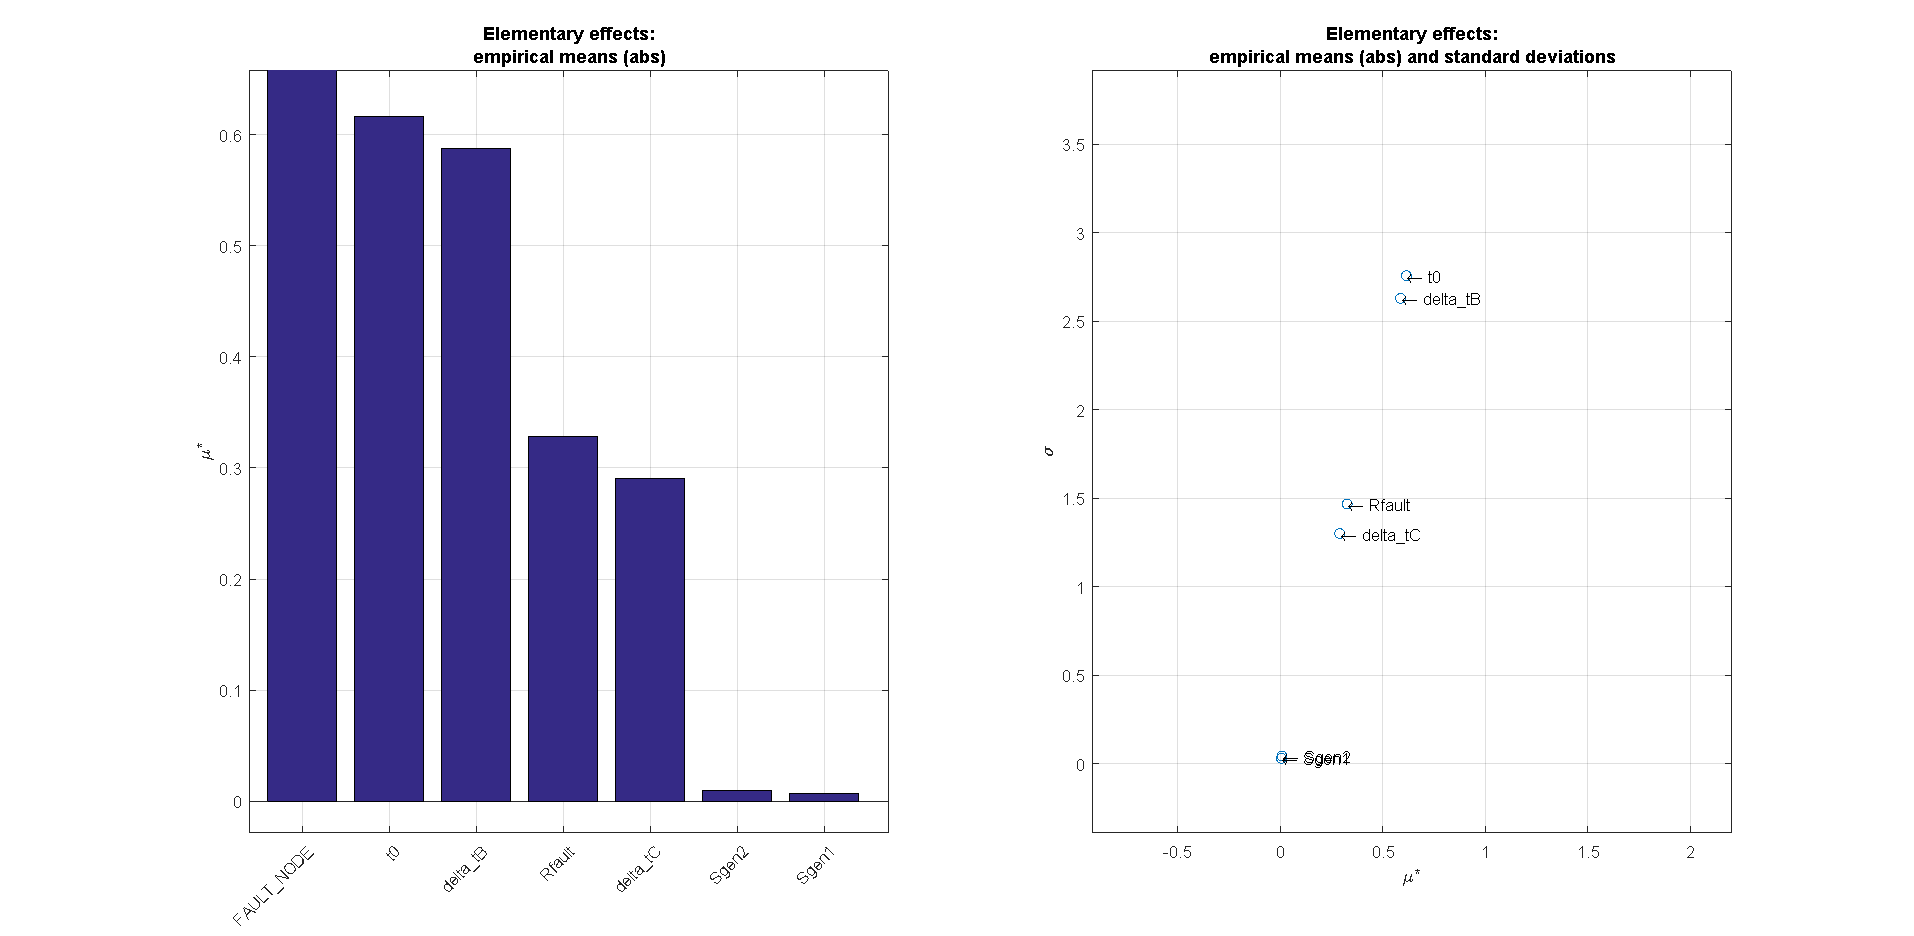
Example of Morris Sensitivity analysis plot. The influence of parameters Sgen1 and Sgen2 on the results is limited.
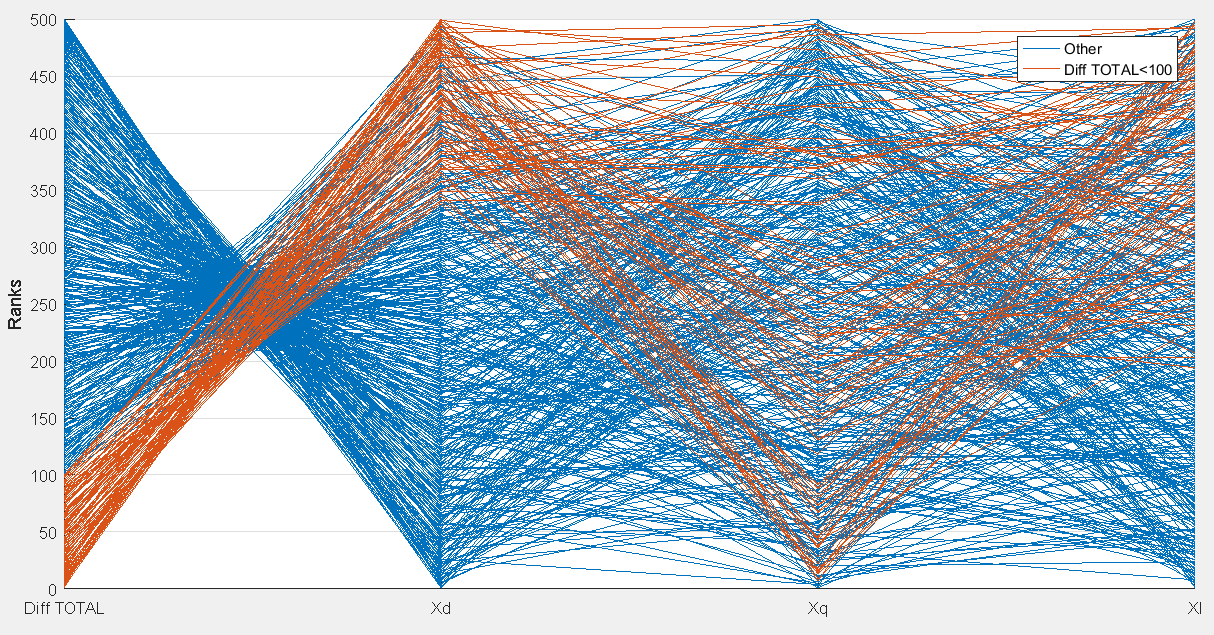
PAMSUITE also includes powerful graphical methods for sensitivity analysis, scatter plots and cobweb plots:
Optimization
Multivariable optimization is offered to determine the values of parameter per objectives and criterions. The optimization algorithm is automatically selected according to optimizing signals to reduce calculation time.
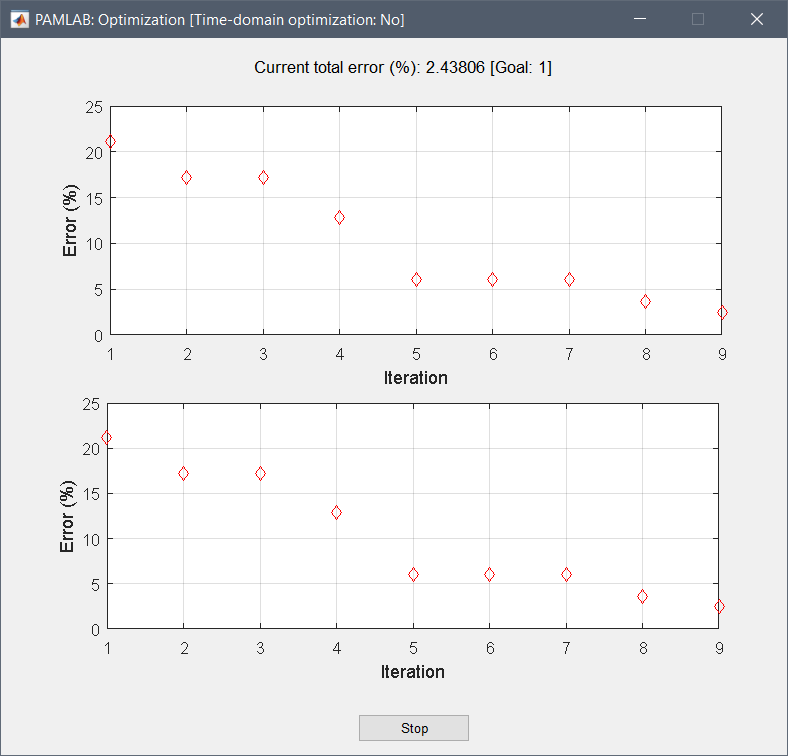
Example of two-parameters optimization monitor
Model calibration and data assimilation
Parameters are not always fully meaningful. They sometimes just represent a knob to turn in a simplified model representation. Besides, parameter values are sometimes unknown or uncertain. Therefore, it is generally recommended to calibrate and validate a model before using it in an actual project. A good example is the recent recommendation of NERC (MOD 026 and 027) regarding the verification of models and data for synchronous generators.
PAMSUITE includes a set of tools to quickly implement data-assimilation and calibration for arbitrary EMTP® models.
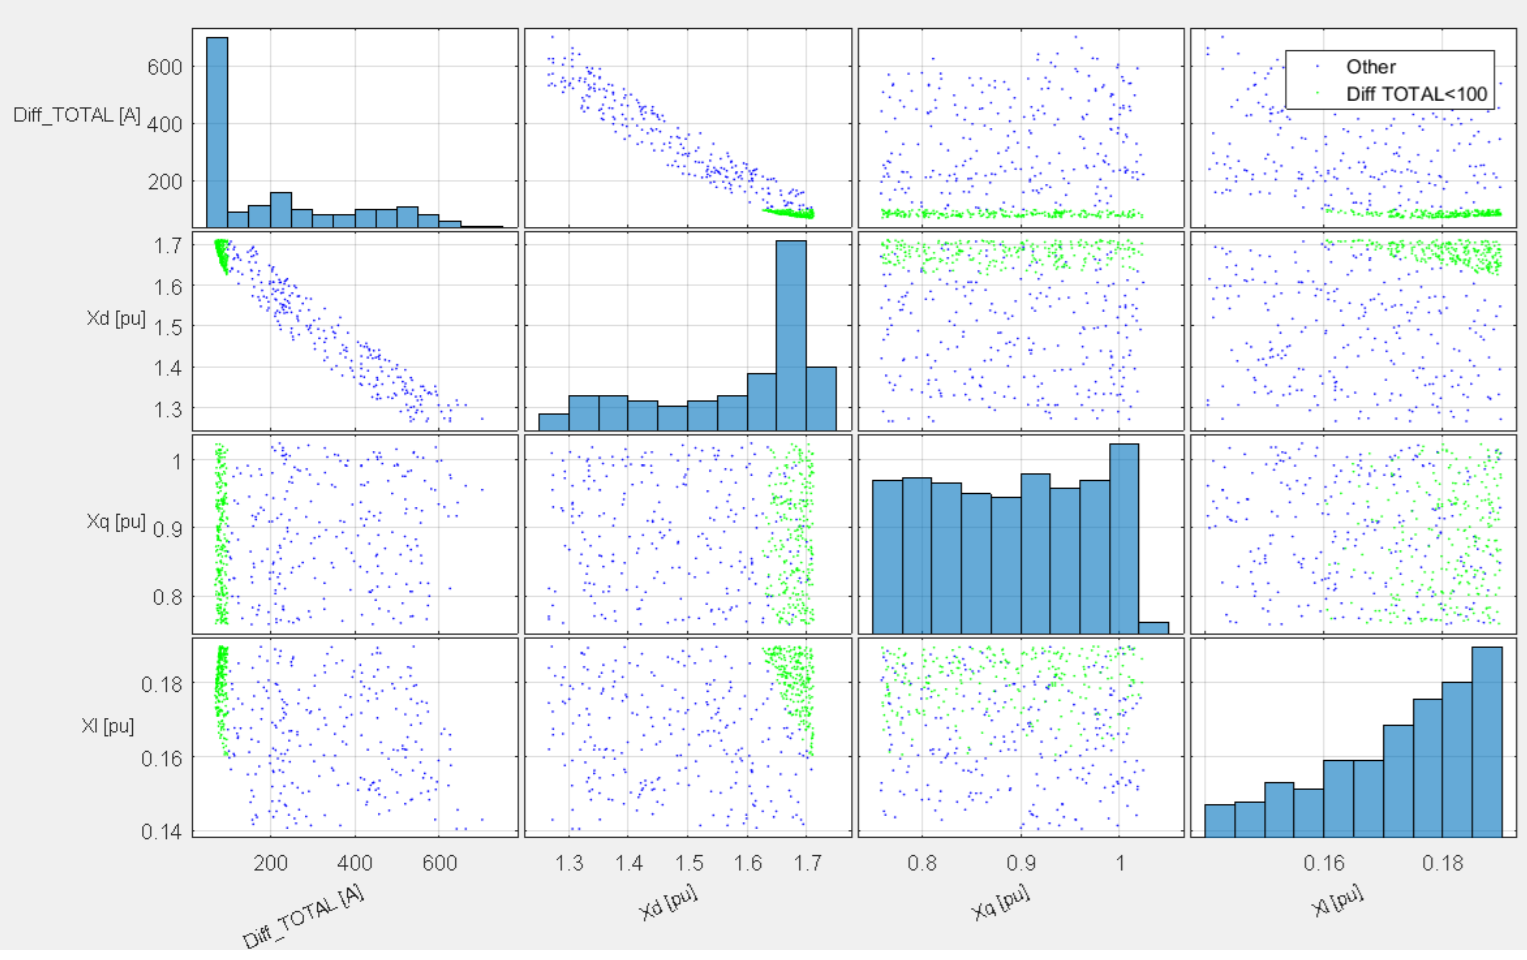
Model calibration - Scatter plot. Green points indicate the set of parameter values with the best match between simulation and measurements.
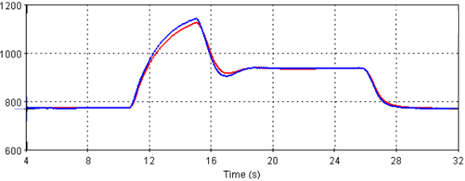
Comparison between model and measurements after model calibration with PAMSuite (generator excitation current after a change of load)